

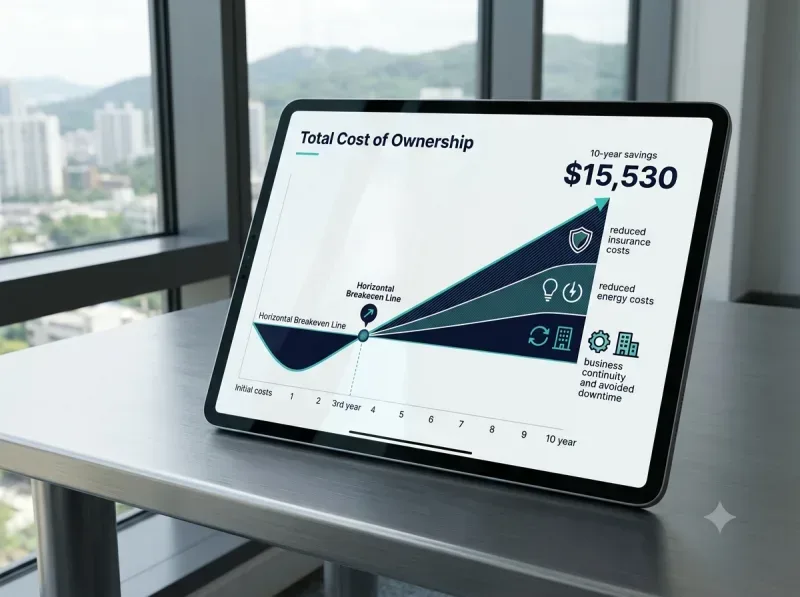
Total Cost of Ownership
Model the full cost and payback of upgrades
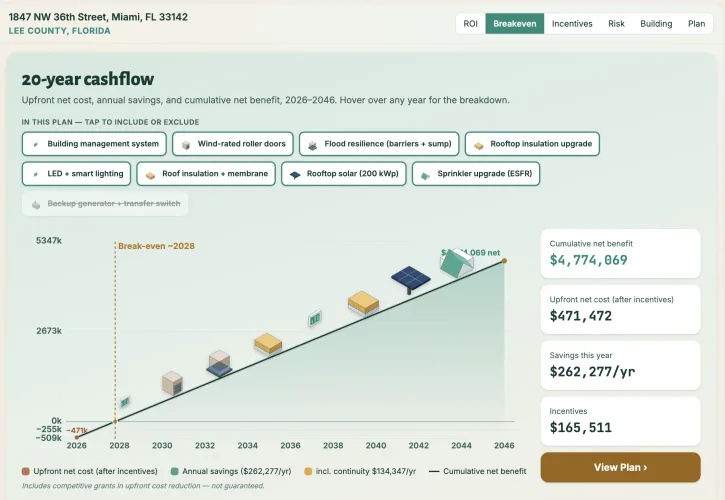
AtlasAdapt combines upgrade costs, applicable incentives and projected annual savings into a single clear view — so homeowners and businesses can see exactly when an investment pays for itself.
Request a demoCosts, savings and payback in one view
Resilience upgrades represent a genuine financial decision — and the numbers are rarely obvious. AtlasAdapt pulls together the upfront cost of each upgrade, subtracts applicable grants and rebates, then models annual savings from reduced insurance premiums, lower energy bills and avoided business disruption. The result is a clear cashflow chart showing time to break-even and cumulative benefit over five or ten years, presented in a visual format your customers can understand immediately.
Solutions
How AtlasAdapt Helps You
Net upgrade cost
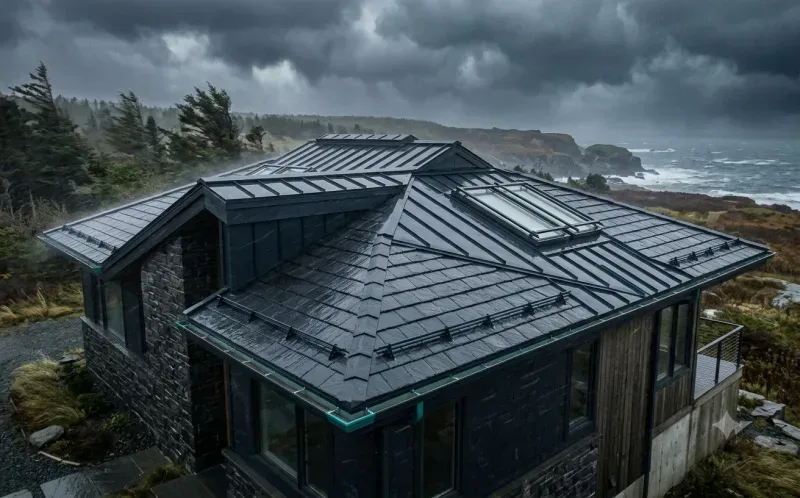
We combine installed cost estimates with all applicable incentives to show the true out-of-pocket cost of each upgrade after grants and rebates.

Annual savings modelled
Savings from lower insurance premiums, reduced energy bills and avoided disruption costs are calculated and displayed year by year for each upgrade scenario.
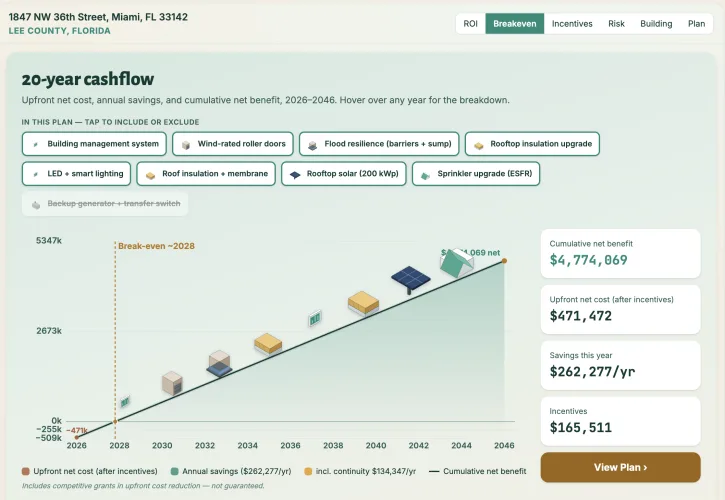
Payback period, clearly shown
A plain-language cashflow chart shows exactly when each upgrade breaks even — giving homeowners and businesses the confidence to act.
We model what actually happens — not just days closed
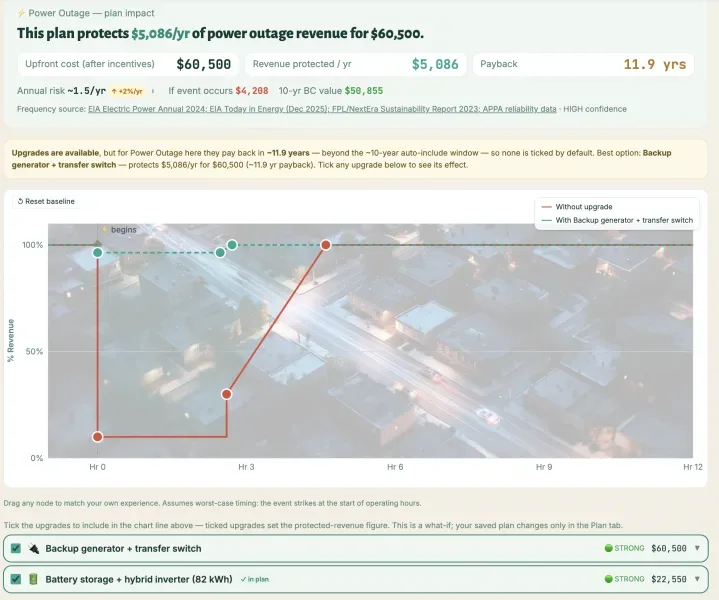
A power outage lasting four hours doesn't cost you four hours of revenue: the business keeps running — impaired, not dark — and when power returns it takes time to restore full operation, so the real cost is a fraction of hourly revenue during the outage plus a recovery tail after it. A fire lasting four hours, though, can cost four weeks of revenue and four more weeks of partial operation; a flood that enters for six hours can shut you down for thirty days. Every other tool models both events identically — days closed × daily revenue — which is simply wrong for an outage and badly over- or under-states a fire or flood. AtlasAdapt models partial operation during the event, graduated revenue recovery after it, and event frequency calibrated to your country and location — giving you an accurate, defensible business case and a payback period you can stand behind in front of a CFO.
The model
Three things most models get wrong.
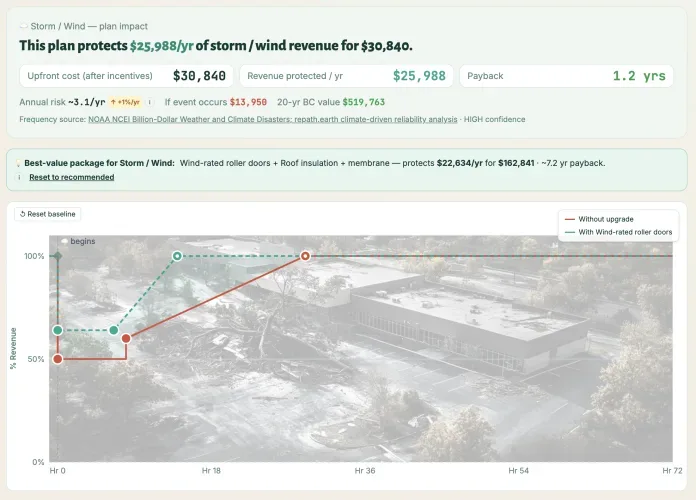
Impaired not dark
Every other tool charges four hours of revenue for a four-hour outage. The business stays open — impaired, not dark — then takes time to reach full output again. We cost the acute phase and the restoration tail separately, in hours, several times a year.
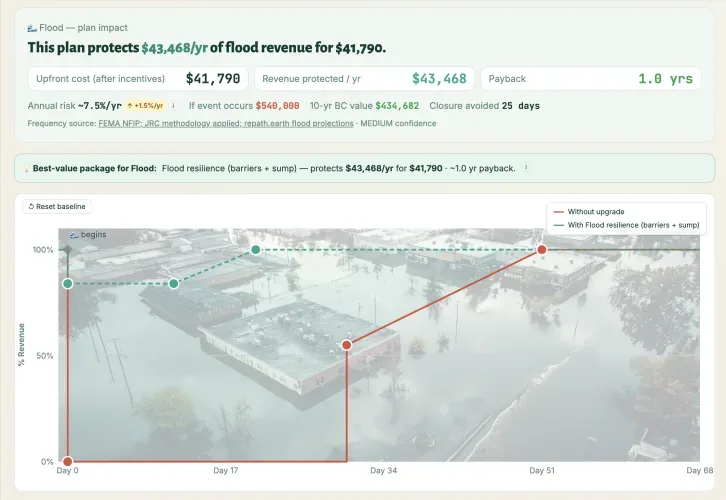
Closure has a tail
Reopening the doors isn't the end of the cost. Fire or major flood closes a building for days or weeks; moderate flood and storm damage add a long partial-operation phase through cleanup, drying and reinstatement. We cost both phases, and show the full scenario cost — because this is the event that ends businesses.
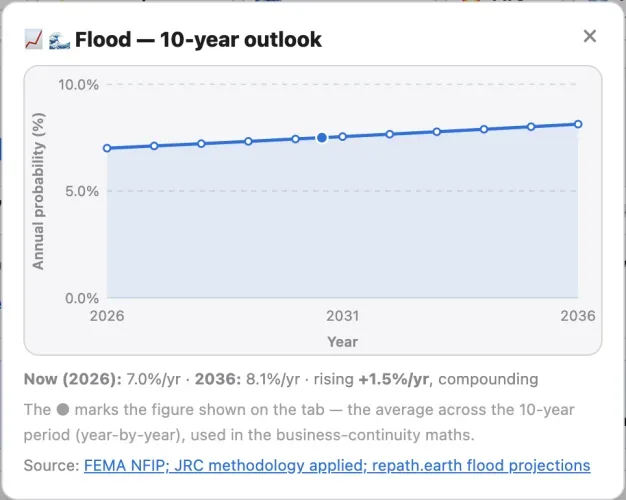
Rising frequency
A ten-year payback calculated on today's event rate is already wrong. We set a base rate per hazard from the historical record, then apply an observed trend — so a 5, 10 or 20-year projection doesn't assume the next two decades look like the last one.
Calibration
Rising frequency, not a flat line
Most models multiply today's event rate by the number of years. That quietly assumes the 2040s look like the 2020s. We set a base rate per hazard from the historical record, then apply an observed trend from the leading source for that peril — so a 5, 10 or 20-year payback reflects the frequency the property is actually likely to face.
- Storms — NOAA NCEI Billion-Dollar Weather & Climate Disasters, 1980–2024 archive, continued by Climate Central
- Flood — FEMA NFIP claims history with JRC depth-damage methodology
- Hurricane — Colorado State University tropical cyclone impact probabilities (HURDAT2)
- Fire — NFPA structure fire incidence
- Outage and heat — EIA, OSHA and C2ES
A worked example: a Florida restaurant with 4 outages a year
On $5,000 daily revenue across a 14-hour day, that's roughly $357 an hour. Without backup power, outages cost around $4,100 a year in lost revenue and recovery time.
A standby generator — typically $10,000–$15,000 installed — cuts that exposure to around $120 a year. At roughly $4,000 in annual savings before servicing and fuel, it pays for itself in about 3–4 years.

Pre-filled with real data. Editable in seconds.
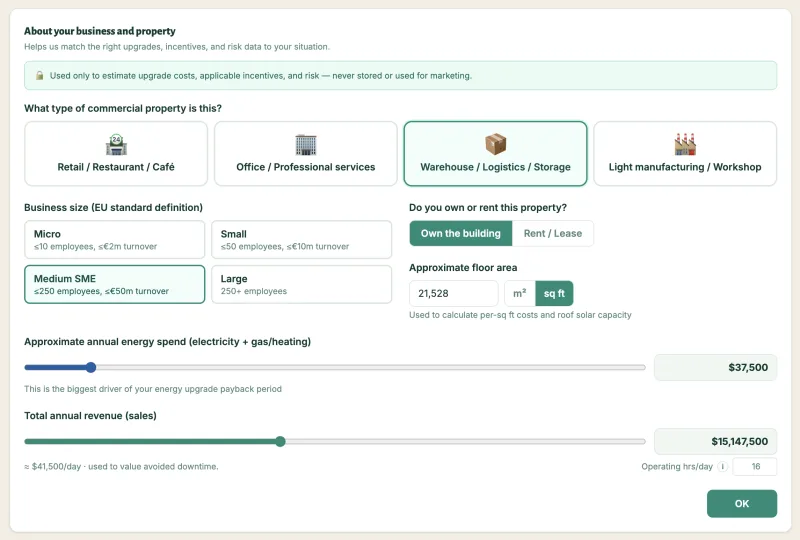
Every input is pre-populated with research-based defaults for your country and building type — daily revenue, operating hours, revenue impact during and after an event, and outages per year (Florida and Switzerland differ by more than an order of magnitude — US figures from EIA Form 861). Fire probability is set by building type — NFPA data for US properties, ABI actuarial data for UK properties; flood probability is read from the address's flood-zone designation. Change any value and every figure updates instantly. Pre-fills are labelled ESTIMATE; once you confirm a value it shows a green tick.
For your clients
What your policyholders and borrowers actually see
A third savings stream
Business-continuity value joins insurance and energy savings as a third stacked bar in the upgrade calculator — making the total case for any upgrade immediately legible.
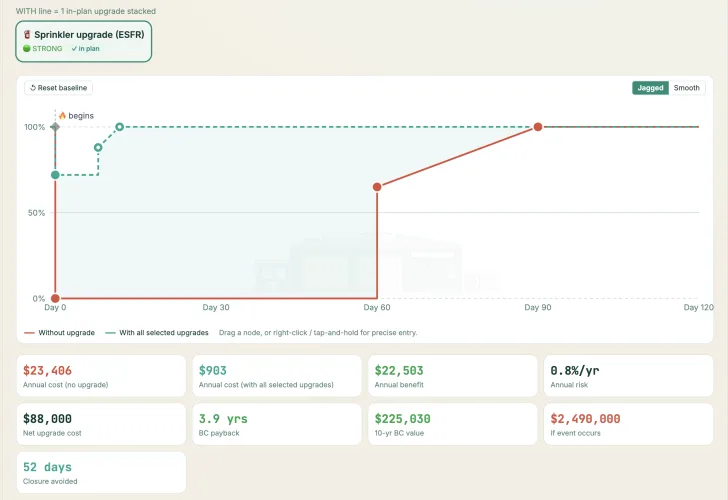
Scenario panels for catastrophes
For fire and flood, a panel shows the full exposure — for example 45 days of closure at $8,000 a day, a $360,000 potential loss — with expected value and scenario value side by side.
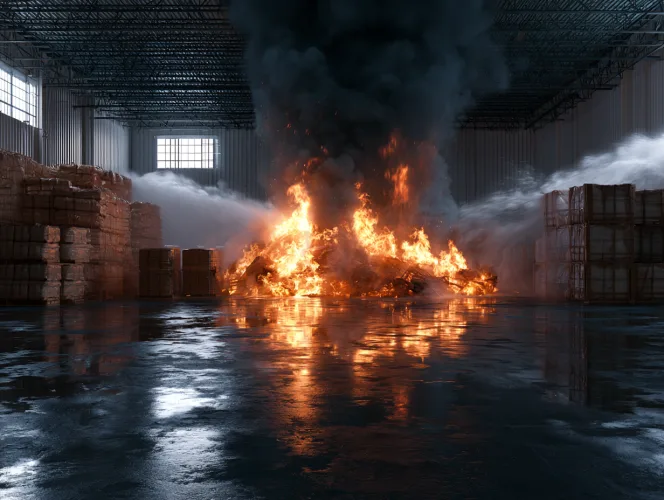
Payback that includes continuity
A warehouse sprinkler that looks like an 18-year payback on insurance alone becomes a 6-year payback once business-continuity value is included — the difference between nice-to-have and do-it-this-quarter.
Why this changes the commercial conversation
- Payback periods shorten meaningfully — generators and battery systems look weak on insurance savings but strong on continuity, and often become the highest-ROI upgrade in the package.
- Different events get the right framing — outages as a running annual cost, fire as a low-probability scenario, matching how owners actually think about risk.
- It handles the conversation a loss-control engineer can't — the financial case in real time, tailored to that business's revenue, hours and local event frequency.
- Your brand on a genuinely differentiated tool — no competing white-label platform uses a graduated impairment model.

Talk to our team
Whether rates are rising or falling, brokers are reporting the market. AtlasAdapt gives you the costed alternative — exposures, upgrades, incentives and the payback year, under your brand.